
Closing the Safety Gap
The safety gap is that dimly lit space between what is and what should be, between the expectations set forth by your safety program and the actual work practices that take place on your work sites. Within that gap lurks all that we hope to avoid. As safety managers, one of our primary objectives is to close the safety gap by identifying and eliminating risk in our work environments. To do so, however, requires clarity. Without a thorough understanding of our risks, both historical and present, we are left with a static, generalized program that is not responsive to the dynamics of our work.
Allow me to illustrate the importance of clarity. Imagine you are in a small airplane flying along at 7,500 feet. There are mountains in the area, but as long as you maintain visibility and altitude, they should not pose a problem. Gradually, however, conditions worsen to the point that you realize that you can see neither the ground nor the horizon. You’re still flying, but for how long?
If you do lose visibility, the first order of business is to pinpoint your exact location using your available navigational aids, and then to set a course away from the mountains. As with flying an airplane, obtaining clarity is vital to effectively managing a safety program, so how do we go about it?
Start with Your History
The first step is to understand your past. The company I work for, Professional Safety Solutions LLC, has found that one of the most efficient ways to do this is by using the Pareto principle, which states that, in many situations, roughly 80 percent of the effects come from 20 percent of the causes. While the theory was originally developed in the early 1900s to explain real estate ownership, we use it to understand our historical risk.
The application of this principle – known as a Pareto analysis – is quite simple. You start by creating a list of categories into which both past incidents and future observations will fit. It is important that your list be complete but not overly detailed. Try to envision the risk components of your work environments, e.g., fall protection, cranes and rigging, and driver safety. An example of a list my company developed can be found in Figure 1 below.
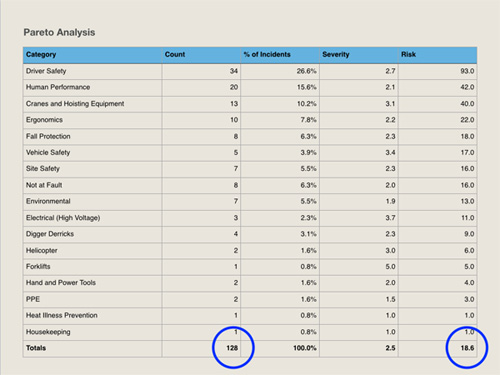
Next, compile your incidents from the past three years, assigning a category to each one. The farther back you go, the more complete your analysis will be. Referring back to Figure 1, you see that for every category, we know the number of incidents, the percentage of total incidents, the average severity and the risk. We define risk as a function of frequency and severity. Of course, you can create a more detailed analysis over time, but we have found this to be a solid start.
We noticed a few things from our list immediately. First, we had 128 incidents in three years. On a scale of 1 to 5, the weighted average severity of each incident was 2.5. The average risk across all categories was 18.6. Looking a little closer, we noticed that the top seven categories by risk accounted for 76 percent of our incidents. With just this simple exercise, we have exponentially increased our clarity.
Hypothetically, what would have happened if we had eliminated all of the driver safety incidents? The total number of incidents would have decreased from 128 to 94, a 26 percent reduction. The risk rating would have gone from a frightening 18.6 to 13.2, a 29 percent reduction.
What would have happened if we eliminated the human performance incidents as well? The total number of incidents would have been reduced from 128 to 74, a 42 percent reduction. The risk rating would have fallen from 18.6 to 10.7, also a 42 percent reduction. Again, amazing. By simply eliminating the top two sources of our incidents, we would have reduced our risk by almost 50 percent.
To take it one step further, what would have happened if we eliminated cranes and hoisting equipment incidents as well? Total incidents would have dropped from 128 to 61, a 52 percent reduction. Our risk rating would have plummeted from 18.6 to 8.4, a 55 percent reduction.
The point of this exercise is to recognize that the top three categories contributed more than half of our risk. This simple analysis gave us our focus. We are not saying that one category is more important than another. In fact, our findings vary from client to client. The important step is knowing the nature of your historical risk. From there you will get your focus and the beginnings of your strategy.
Observation: Understanding Risks in Real Time
Once we have historical clarity, we need to focus on present-day risks, so the next step is to establish an observation program. We began with the same list of categories that we used in our Pareto analysis. For each category, we created a list of what we call “critical actions.” A critical action is an observable behavior that, if executed, likely would have averted an incident. For instance, a critical action in driver safety would be keeping your eyes on the road. A critical action when working with cranes and hoisting equipment would be to verify the capacity of your rigging and the weight of your load. These critical actions become the basis of field checklists. The objective is to observe and encourage specific safe work practices. We would rather conduct work site observations than incident investigations.
Our observation program is the very core of Professional Safety Solutions’ strategy. On average, our company’s teams conduct well over 400 inspections – including more than 14,000 individual critical action observations – per month.
Over the years, we have discovered four basic truths relative to work site observations.
Truth 1: The more inspections you perform, the safer your work environments become. To us, this is as verifiable as gravity. We work with a broad spectrum of organizations across many different industries, but one common thread unites them all: The more formal observations they perform, the fewer incidents they have. We have found that every work location or crew should be formally observed once per week. That remains our target to this day.
Truth 2: The more observations you perform per inspection, the safer your work environments become. In other words, the more categories you observe, the more critical actions you confirm, the more effective your observation program will become. The tendency of many safety professionals is to focus on the few at-risk behaviors, similar to a police officer writing a ticket. Remember, we are trying to both correct at-risk behavior as well as encourage the performance of critical actions.
Truth 3: The greater the diversity of your observers, the safer your work environments become. One of our primary strategies is to partner with clients to train their leaders to observe crews using our technology and approach. Combining the objectivity of a third party with the proximity of local observations has proven very effective. One of our clients has 11 peer leadership observers averaging 150 inspections and more than 5,500 critical action observations per month. The leverage and impact have been incredible. Most notably, they have not had a recordable incident in more than 14 months.
Truth 4: It’s not just about the data. I admit that I am fascinated by data. When we first began developing observation programs for our clients, we focused on the data, its meaning and ultimately its application. But we have learned that a vital component of any observation program is the observer. The time spent building relationships with the crews, reinforcing critical actions and encouraging safe behavior has an immeasurable impact. We continue to focus on training observers to be effective change agents in their work environments.
Never Stop Learning
We have found that the most effective organizations are always learning. They learn from their incidents, from their observations and from their people. When the Pareto analysis of both your incidents and your field observations is updated in real time, it delivers a very clear understanding of where your risks are and thus where you need to focus your attention. Once you have this clarity, you will begin to anticipate risks before they become incidents.
About the Author: Thomas Arnold, CSP, CUSP, is a managing partner at Professional Safety Solutions LLC (www.prosafellc.com) in Coronado, Calif. He has focused on risk management for more than 21 years and is both a published writer and conference speaker. Arnold’s primary area of expertise is observation program optimization and predictive analytics. He oversees a team of field safety advisers deployed on utility projects nationwide.